
Supply Chain Inventory Visibility
The solution went live with 10+ Channel Partners in 2022. Boosted SAP cloud usage by $1M. Signed a $1.5M implementation contract.
My Role
Lead designer of a team of three. Worked closely with developers, data scientists, PM, and customer stakeholders.
Responsibilities
Research, design workshop, UX and visual design, customer engagement.
Deliverables
User synthesis; web solution;
When Valvoline fulfilled customer orders through distributors (Channel Partners), the visibility into the customer orders is missing, which resulted in low customer satisfaction and backorder complexities.
“HMW… help improve the order visibility?”
-Initial Problem Statement
User Research
I quickly gathered a study plan through context research and a customer stakeholder workshop. I also facilitated a technical user session for the technical environment evaluation.
In total, twenty-one participants joined a two-week dive-in user study, including:
Target Users
Regional Manager; Supply Chain Tire II; Customer Service
Direct Stakeholders
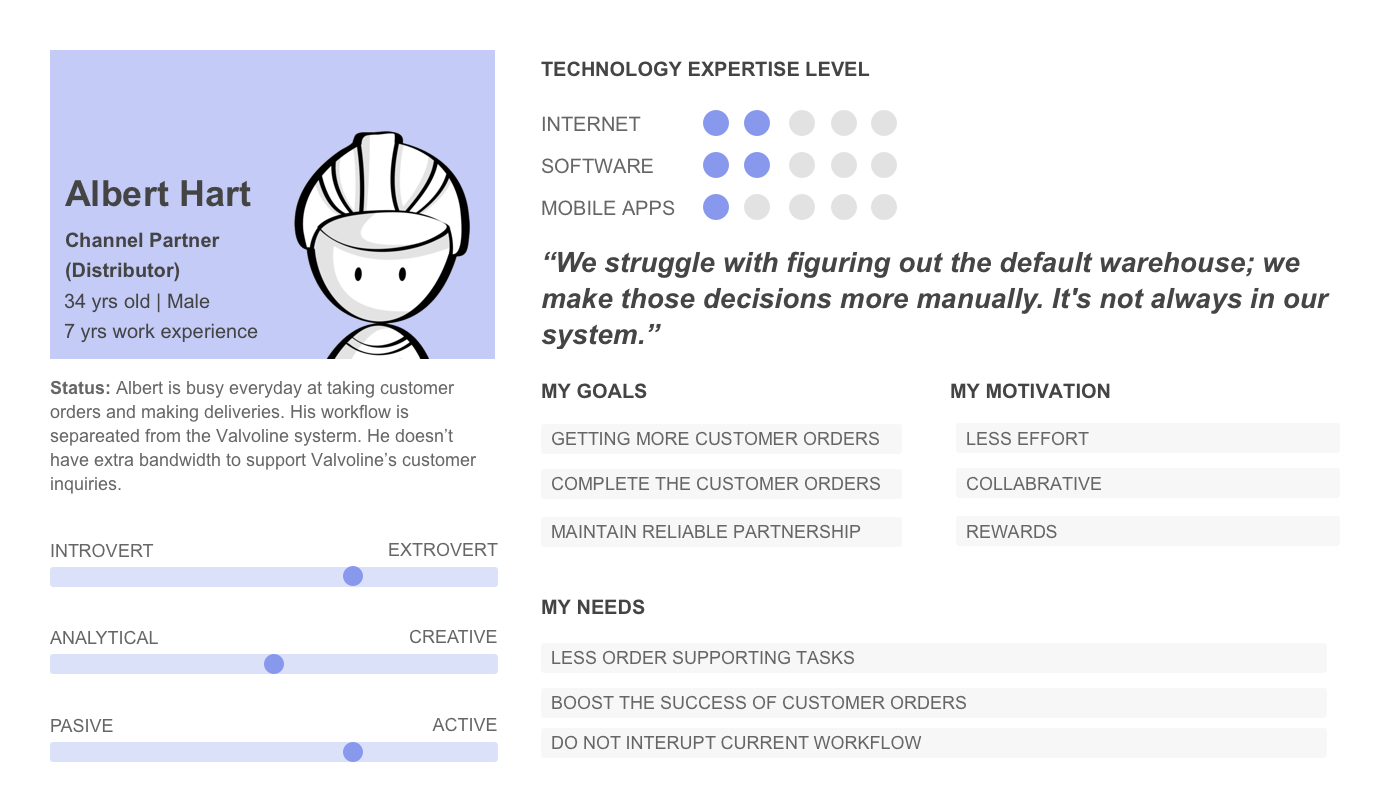
IT Admin; Channel Partner
Indirect Stakeholders
Sales; Valvoline’s Customers

In-person customer design thinking workshops I facilitated prior to the pandemic
Due to the pandemic, we facilitated virtual workshops through Mural Board.
First, is it a valid problem?
We learned that lack of order visibility is a big hurdle to the business:
High cost of processing 1.2K "order visibility" escalation cases.
Hard to scale business with more channel partners.
Low customer satisfaction.
How does the problem happen?
By observing the user’s current as-is flow, we got to know that an escalation case is opened if a Valvoline CSR (Customer Service Representative) can’t provide the order status for a delayed customer order. The biggest bottleneck is “Hard to find out the stock/inventory”. It can involve up to five teams and six systems for the source of the truth.


“ I literally called three times, emailed three times…failed the customer request as I was unable to get information from a distributor.”
- Regional Managers, Supply Chain


needs and goals Define


“HMW…
help build Automatic, Easy access, and Easy-maintained single source of the truth of Distributor inventory?”
- Problem Refinement
Design Scope

For Supply Chain Coordinators & Regional Manager’s personas,
Build Inventory Analytics platform for exploring CP inventory data.
When there is a customer inquiry, the user can check on inventory details.
proactively Detect the Potential order risk, and notify the customer in advance.
When there are no customer inquiries, the user can proactively notify the customer of the delay before a complaint is filed.
For IT Admins & Distributors personas,
Build A new data communication flow:
Uploading, monitoring & hosting CP inventory data.
Provide open APIs:
Future build with other applications.
Stakeholders Alignment
To align the design scope among stakeholders, I pitched the solution in multiple formats to different audiences: To-be UX Journey, Architecture map, and user scenarios.
A particular step I took was translating the architecture map into non-tech languages.
I can identify design opportunities and boundaries by walking through the elements with developers. It helped communicate the design visions to stakeholders.
Conflicts Between Data and Design
“What kind of data do we need?”
- Data Eng & PM
“What data is feasible to use in the design?”
- Designer
The engineers, pm, and customers cannot reach a conclusion on the specific set of data to use. There were back and forth discussions with excel sheets, questionnaires, and whiteboarding. To give the definition of “true visibility and insights”, I realized that it isn’t easy to conclude without some user context.
To resolve the conflicts:
I created user scenarios vs. data hierarchy blueprint - mapping out the persona’s data-consuming path with its supporting data points:
Then, I used this version as the starting point, worked with customer stakeholders, and verified the user needs as well as the data requirements. This approach has become a standard project process in my org. The benefit is that:
Not only do designers get to know if the design has successfully met the user needs, but developers also create the data requesting template from this blueprint.
mockup iterations
We made several rounds of mockup ideations. We collected feedback from the end-users, stakeholders, team members, and design team members for each iteration.


4 Rounds of Ideations -Working File Example.
design highlights
1. Mapping user Flow with business logic and data structure at an early stage.
I proposed considering business logic and the data hierarchy from the beginning during the user flow design.
First, a synced mapping would take advantage of the user's existing business logic, significantly reducing user learning curvy. Second, a user flow and consistent data structure mapping would save the developer's table organization work, the front-end implementation effort, and extra computation cost, which may lead to UI loading latency.
2. Aware of visualization risk.
One of my design team members proposed the chart ideas to help the manager persona identify more CP inventory insights.
From the early blueprint, I can tell this visualization design requires data aggregation, and we need to be careful about representing users to make decisions on any KIP/or business definition.
Although many supply chain KIP formulas are available online, they do not apply to customers' business criteria after cross-checking with customers and engineers. We learned that each company has its definition; we can't assume they're generic.

3. Get early user feedback on design.
I hosted a bi-weekly design update meeting with stakeholders and end-users, built a good feedback-design iteration loop.
4. Turn limitations into new Business opportunities.
Due to the UI limitation of the new SAP technologies CAP, we can only implement the table view without the visualization charts.
I decided still to prepare some nice-to-have analytics versions to show customer stakeholders about the future UX improvement.
5. follow SAP Fiori UI 5 Figma design system
We also thought through the corner cases before we handoff to Devs.

Impact
70%
of sales orders fulfilled by distributors boost.
40%
Estimated reduction of time spent to investigate an order issue.
“I’ve worked on other SAP projects previously. This is the first time I feel everything I said is heard, validated, and reflected on the designs.
This SAP team takes our pain points seriously, and the final outcome provides the inventory visibility into the distributors that we’ve been wanting for a long time.”
-
Christin Grubaugh,
North America Supply Chain Manager, Valvoline Inc.
